|
My predictions to the actual graph weren't very far off of the actual graphs, but they were different in that I had drawn the graph so the skateboard went farther faster and slowed or receded slower or less. The initial reasoning that lead me to the first graphs was that the skateboard was traveling faster and farther than it actually was. The zeros of the graph represent the starting point and end point of the skateboard. In terms of zeros, they start at the same place but the graphs end differently depending on the height that the skateboard was first dropped from. The higher the ramp, the closer the end zero was number-wise to the first zero. The skateboard dropped from the lowest ramp differed the most in its zeros. The graphs differ in their maximums because they traveled farther, the higher the ramp they were dropped from. The board dropped from the 21 inch ramp has a higher maximum on the graph than the board dropped from the seven inch graph. They graphs do not have minimums because the boards do not travel forward again once they have slowed to a stop. The graphs are rising the fastest directly after the skateboard has been dropped from the ramp. This is because the momentum from being dropped is propelling the board forward until it begins to slow. The graphs are falling the fastest right when they begin to roll backwards, because since they still have enough momentum left from falling from the ramp, they begin to roll backwards once they hit a bump in the driveway. 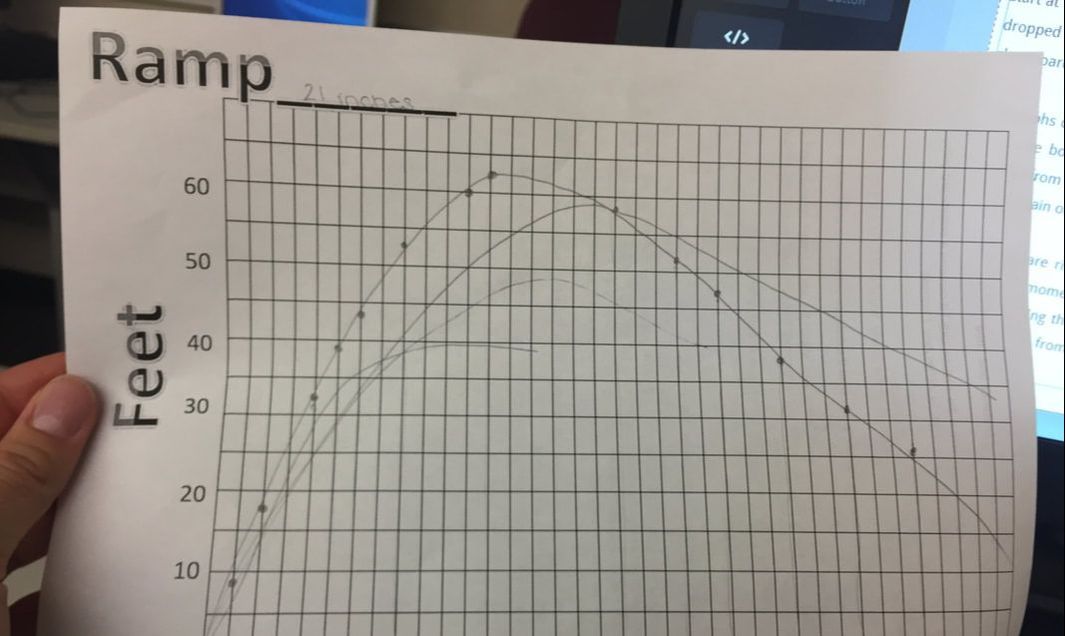 This is the graph for the skateboard that was dropped from the 21 inch ramp. As you can see, the maximum distance traveled of this skateboard was about 63 feet. 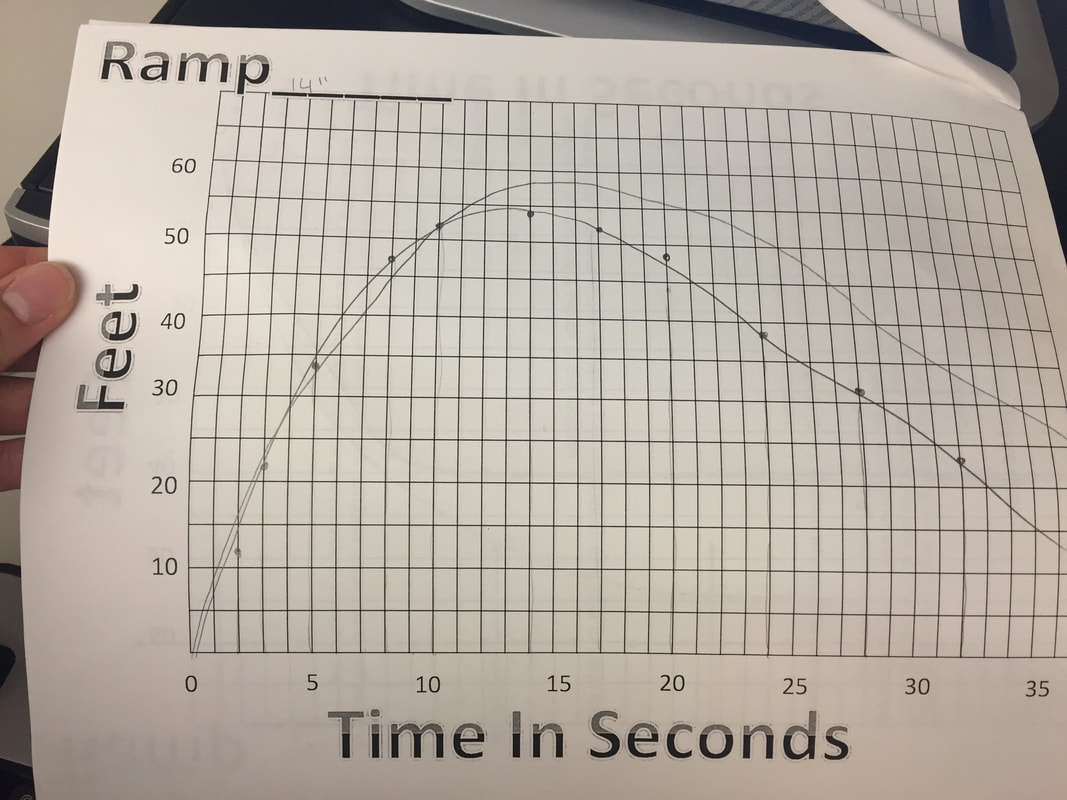 This is the graph for the skateboard that was dropped from the 14 inch ramp. The maximum of this graph is about 55 feet. 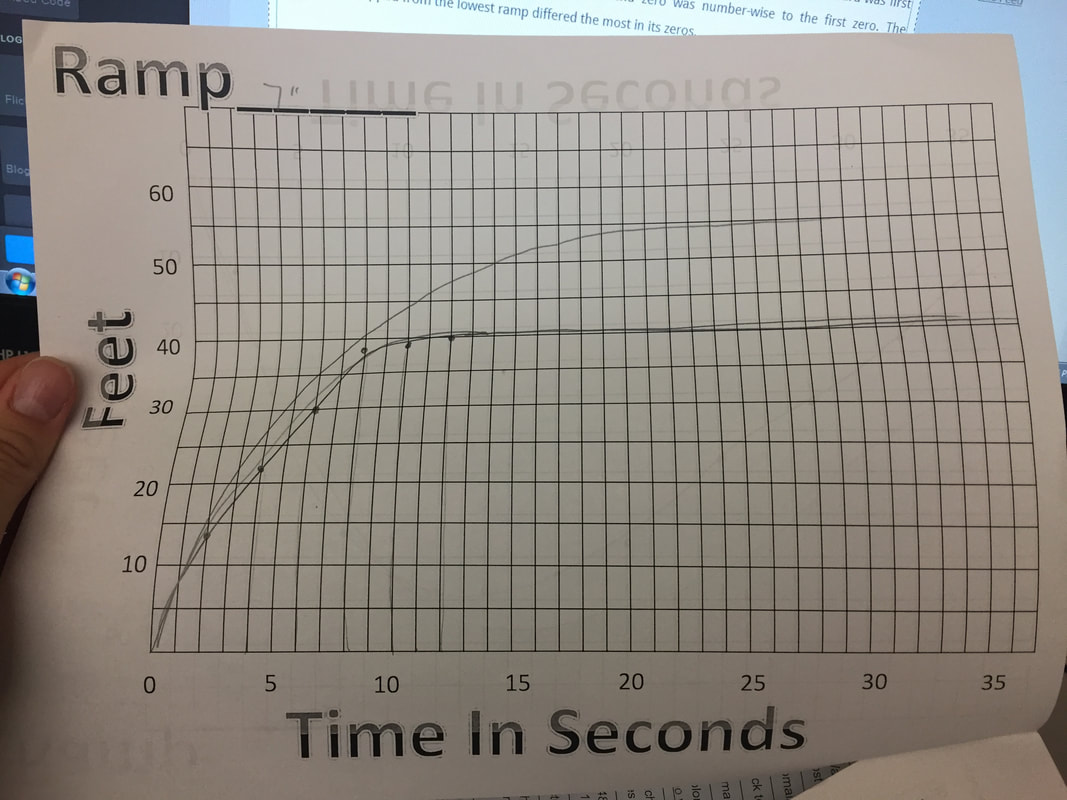 This is the graph for the skateboard that was dropped from the 7 inch ramp. This skateboard traveled a maximum distance of about 40 feet before leveling out.
0 Comments
Leave a Reply. |
Kayla CampbellArchives
November 2017
Categories |
 RSS Feed
